Table of Contents
- Introduction
- Minimal Theory
- Step 1. Reproduce and confirm the problem
- Step 2. Take at least 3 Heap dumps
- Step 3. Find the problem
- Step 4. Confirm that the issue is resolved
- Links to some other resources
- Summary
Something you might want to bookmark: Simple Guide to Finding a JavaScript Memory Leak in Node.js by @akras14 https://t.co/oRyQboa8Uw
— Node.js (@nodejs) January 6, 2016
Please consider reviewing this guide on Amazon, if you’ll find it helpful.
Introduction
Few months ago, I had to debug a memory leak in Node.js. I found a good number of articles dedicated to the subject, but even after carefully reading some of them, I was still pretty confused on what exactly I should do to debug our problem.
My intent for this post is to be a simple guide for finding a memory leak in Node. I will outline a single easy to follow approach, that should (in my opinion) be a starting point for any memory leak debugging in Node. For some cases, this approach may not be enough. I will link to some other resources that you may want to consider.
Minimal Theory
JavaScript is a garbage collected language. Therefore, all memory used by a Node process is being automatically allocated and de-allocated by the V8 JavaScript engine.
How does V8 know when to de-allocate the memory? V8 keeps a graph of all variables in the program, starting from the root node. There are 4 types of data types in JavaScript: Boolean, String, Number, and Object. First 3 are simple types, and they can only hold on to the data that is assigned to them (i.e. string of text). Objects, and everything else in JavaScript is an object (i.e. Arrays are Objects), can keep references (pointers) to other objects.

Periodically V8 will walk through the Memory Graph, trying to identify groups of data that can no longer be reached from the root node. If it’s not reachable from the root node, V8 assumes that the data is no longer used and releases the memory. This process is called Garbage Collection.
When does a memory leak occur?
Memory leak occurs in JavaScript when some no-longer-needed-data is still reachable from the root node. V8 will assume that the data is still being used and will not release the memory. In order to debug a memory leak we need to locate the data that is being kept by mistake, and make sure V8 is able to clean it up.
It’s also important to note that Garbage Collection does not run at all times. Normally V8 can trigger garbage collection when it deems appropriate. For example, it could run a Garbage Collection periodically, or it could trigger an out of turn Garbage Collection if it senses that the amount of free memory is getting low. Node has a limited number for memory available to each process, so V8 has to use whatever it has wisely.
The later case of out of turn Garbage Collection could be a source of significant performance degradation.
Imagine you have an app with a lot of memory leaks. Soon, Node process will begin to run out of memory, which would cause V8 to trigger an out of turn Garbage Collection. But since most of the data can still be reach from the root node, very little of memory will get cleaned up, keeping most of it in place.
Sooner than later, Node process would run out of memory again, triggering another Garbage Collection. Before you know it, you app goes into a constant Garbage Collection cycle, just to try keeping the process functioning. Since V8 spends most of the time handling Garbage Collection, very little resources are left to run the actual program.
Step 1. Reproduce and confirm the problem
As I’ve indicated earlier, V8 JavaScript engine has a complicated logic that it uses to determine when Garbage Collection should run. With that in mind, even though we can see a memory for Node process continue to go up, we cannot be certain that we are witnessing a memory leak, until we know that Garbage Collection has ran, allowing unused memory to be cleaned up.
Thankfully, Node allows us to manually trigger Garbage Collection, and it is the first thing that we should do when trying confirm a memory leak. This can be accomplished by running Node with --expose-gc flag (i.e. node --expose-gc index.js). Once node is running in that mode, you can programmatically trigger a Garbage Collection at any time by calling global.gc() from your program.
You can also check the amount of memory used by your process by calling process.memoryUsage().heapUsed.
By manually triggering garbage collection and checking the heap used, you can determine if you in fact observing a memory leak in your program.
Sample program
I’ve created a simple memory leak program that you can see here: https://github.com/akras14/memory-leak-example
You can clone it, run npm install and then run node --expose-gc index.js to see it in action.
"use strict";
require('heapdump');
var leakyData = [];
var nonLeakyData = [];
class SimpleClass {
constructor(text){
this.text = text;
}
}
function cleanUpData(dataStore, randomObject){
var objectIndex = dataStore.indexOf(randomObject);
dataStore.splice(objectIndex, 1);
}
function getAndStoreRandomData(){
var randomData = Math.random().toString();
var randomObject = new SimpleClass(randomData);
leakyData.push(randomObject);
nonLeakyData.push(randomObject);
// cleanUpData(leakyData, randomObject); //<-- Forgot to clean up
cleanUpData(nonLeakyData, randomObject);
}
function generateHeapDumpAndStats(){
//1. Force garbage collection every time this function is called
try {
global.gc();
} catch (e) {
console.log("You must run program with 'node --expose-gc index.js' or 'npm start'");
process.exit();
}
//2. Output Heap stats
var heapUsed = process.memoryUsage().heapUsed;
console.log("Program is using " + heapUsed + " bytes of Heap.")
//3. Get Heap dump
process.kill(process.pid, 'SIGUSR2');
}
//Kick off the program
setInterval(getAndStoreRandomData, 5); //Add random data every 5 milliseconds
setInterval(generateHeapDumpAndStats, 2000); //Do garbage collection and heap dump every 2 seconds
Code language: JavaScript (javascript)The program will:
- Generate a random object every 5 milliseconds and store it in 2 arrays, one called leakyData and another nonLeakyData. We will clean up the nonLeakyData array every 5 milliseconds, but we’ll “forget” to clean up the leakyData array.
- Every 2 seconds the program will output the amount of memory used (and generate a heap dump, but we’ll talk more about than in the next section).
If you run the program with node --expose-gc index.js (or npm start), it will begin to output memory stats. Let it run for a minute or two and kill it with Ctr + c.
You’ll see that the memory is quickly growing, even though we are triggering Garbage Collection every 2 seconds, right before we get the stats:
//1. Force garbage collection every time this function is called
try {
  global.gc();
} catch (e) {
  console.log("You must run program with 'node --expose-gc index.js' or 'npm start'");
  process.exit();
}

//2. Output Heap stats
var heapUsed = process.memoryUsage().heapUsed;
console.log("Program is using " + heapUsed + " bytes of Heap.")
Code language: JavaScript (javascript)
With the stats output looking something like the following:
Program is using 3783656 bytes of Heap.
Program is using 3919520 bytes of Heap.
Program is using 3849976 bytes of Heap.
Program is using 3881480 bytes of Heap.
Program is using 3907608 bytes of Heap.
Program is using 3941752 bytes of Heap.
Program is using 3968136 bytes of Heap.
Program is using 3994504 bytes of Heap.
Program is using 4032400 bytes of Heap.
Program is using 4058464 bytes of Heap.
Program is using 4084656 bytes of Heap.
Program is using 4111128 bytes of Heap.
Program is using 4137336 bytes of Heap.
Program is using 4181240 bytes of Heap.
Program is using 4207304 bytes of Heap.
If your plot the data, memory growth becomes even more evident.
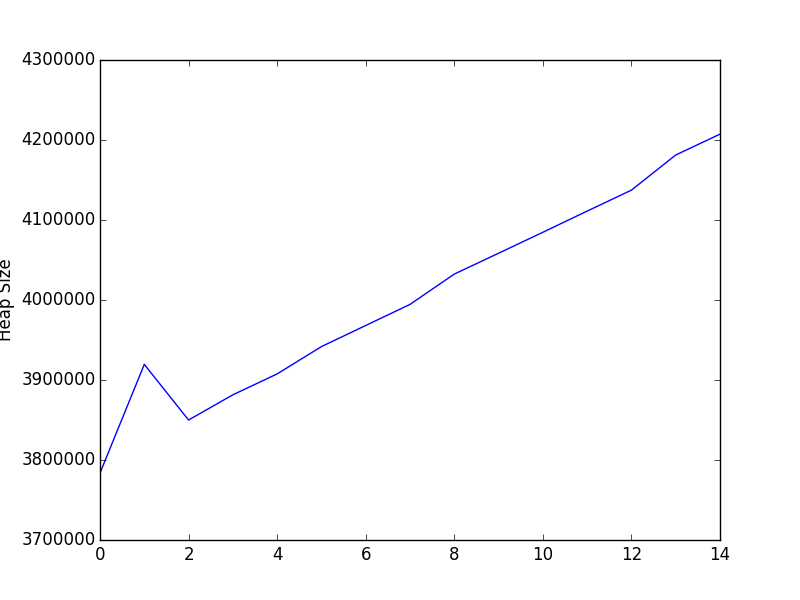
Note: If you curious how I’ve plotted the data, read on. If not please skip to the next section.
I am saving the stats being outputted into a JSON file, and then read it in and plotted it with a few lines of Python. I’ve kept it on a separate brunch to avoid confusion, but you can check it out here: https://github.com/akras14/memory-leak-example/tree/plot
Relevant parts are:
var fs = require('fs');
var stats = [];

//--- skip ---

var heapUsed = process.memoryUsage().heapUsed;
stats.push(heapUsed);

//--- skip ---

//On ctrl+c save the stats and exit
process.on('SIGINT', function(){
  var data = JSON.stringify(stats);
  fs.writeFile("stats.json", data, function(err) {
    if(err) {
      console.log(err);
    } else {
      console.log("\nSaved stats to stats.json");
    }
    process.exit();
  });
});
Code language: JavaScript (javascript)
and
#!/usr/bin/env python

import matplotlib.pyplot as plt
import json

statsFile = open('stats.json', 'r')
heapSizes = json.load(statsFile)

print('Plotting %s' % ', '.join(map(str, heapSizes)))

plt.plot(heapSizes)
plt.ylabel('Heap Size')
plt.show()
Code language: JavaScript (javascript)
You can check out the plot branch, and run the program as usual. Once you are finished run python plot.py to generate the plot. You’ll need to have Matplotlib library installed on your machine for it to work.
Or you can plot the data in Excel.
Step 2. Take at least 3 Heap dumps
OK, so we’ve reproduce the problem, now what? Now we need to figure out where the problem is and fix it 🙂
You might have noticed the following lines in my sample program above:
require('heapdump');
// ---skip---

//3. Get Heap dump
process.kill(process.pid, 'SIGUSR2');

// ---skip---
Code language: JavaScript (javascript)
I am using a node-heapdump module that you can find here: https://github.com/bnoordhuis/node-heapdump
In order to use node-heapdump, you just have to:
- Install it.
- Require it at the top of your program
- Call
kill -USR2 {{pid}}on Unix like platforms
If you’ve never see the kill part before, it’s a command in Unix that allows you to (among other things) send a custom signal(aka User Signal) to any running process. Node-heapdump is configured to take a heap dump of the process, any time it receives a user signal two hence the -USR2, followed by process id.
In my sample program I automate the kill -USR2 {{pid}} command by running process.kill(process.pid, 'SIGUSR2');, where process.kill is a node wrapper for kill command, SIGUSR2 is Node way of saying -USR2, and process.pid gets the id for the current Node process. I run this command after each Garbage Collection to get a clean heap dump.
I don’t think process.kill(process.pid, 'SIGUSR2'); will work on Windows, but you can run heapdump.writeSnapshot() instead.
This example might have been slightly easier with heapdump.writeSnapshot() in the first place, but I wanted to mention that you can trigger a heap dump with kill -USR2 {{pid}} signal on Unix like platforms, which could come in handy.
Next section will cover how we can use the generated heap dumps to isolate the memory leak.
Step 3. Find the problem
In step 2 we generated a bunch of heap dumps, but we’ll need at least 3, and you’ll soon see why.
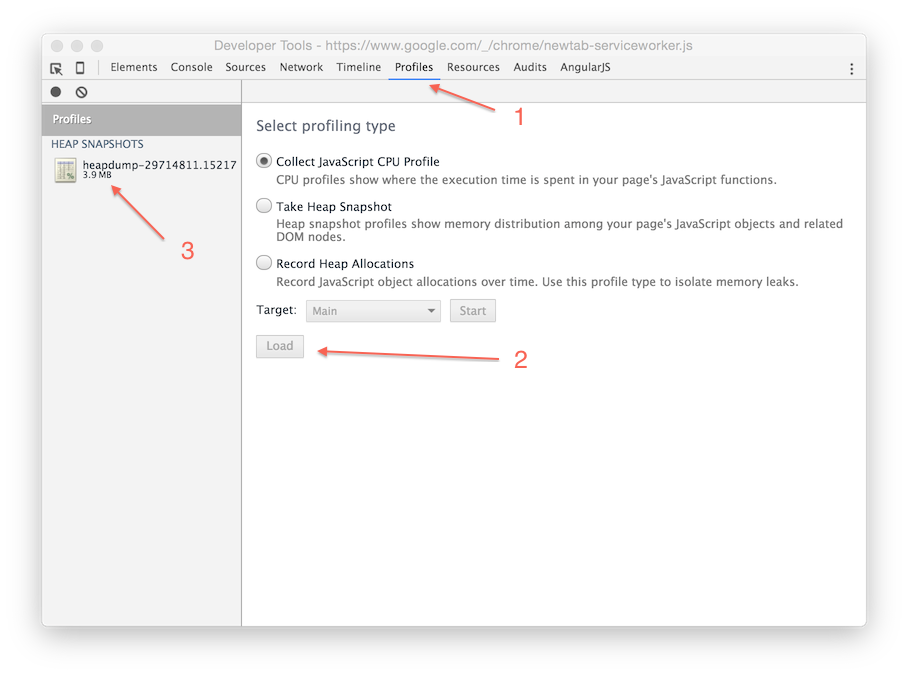
Once you have your heap dumps. Head over to Google Chrome, and open up Chrome Developer tools (F12 on Windows or Command + Options + i on Mac).
Once in the Developer Tools Navigate to “Profiles” tab, select “Load” button at the bottom of the screen, navigate to the first Heap Dump that you took, and select it. The heap dump will load into the Chrome view as follows:
Go ahead an load 2 more heap dumps into the view. For example, you can use the last 2 heap dumps that you’ve taken. The most important thing is that heap dumps must be loaded in the order that they were taken. Your Profiles tab should look similar to the following.
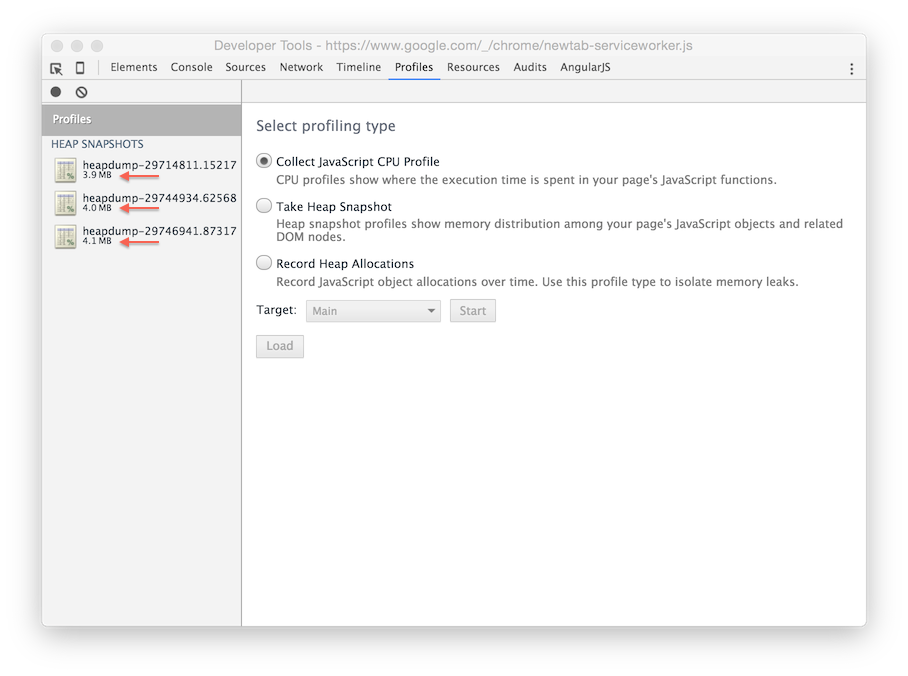
As you can tell from the above image, the Heap continues to grow a little over time.
3 Heap Dumps Method
Once heap dump is loaded you’ll see a lot of sub-views in the Profiles tab, and it’s easy to get lost in them. There is one view, however, that I found to be particularly helpful.
Click on the last heap dump that you have taken, it will immediately put you into the “Summary” view. To the left of the “Summary” drop down, you should see another drop down that says “All”. Click on it and select “Objects allocated between heapdump-YOUR-FIRST-HEAP-DUMP and heapdump-YOUR-SECOND-TO-LAST-HEAP-DUMP”, as can be see in the image bellow.
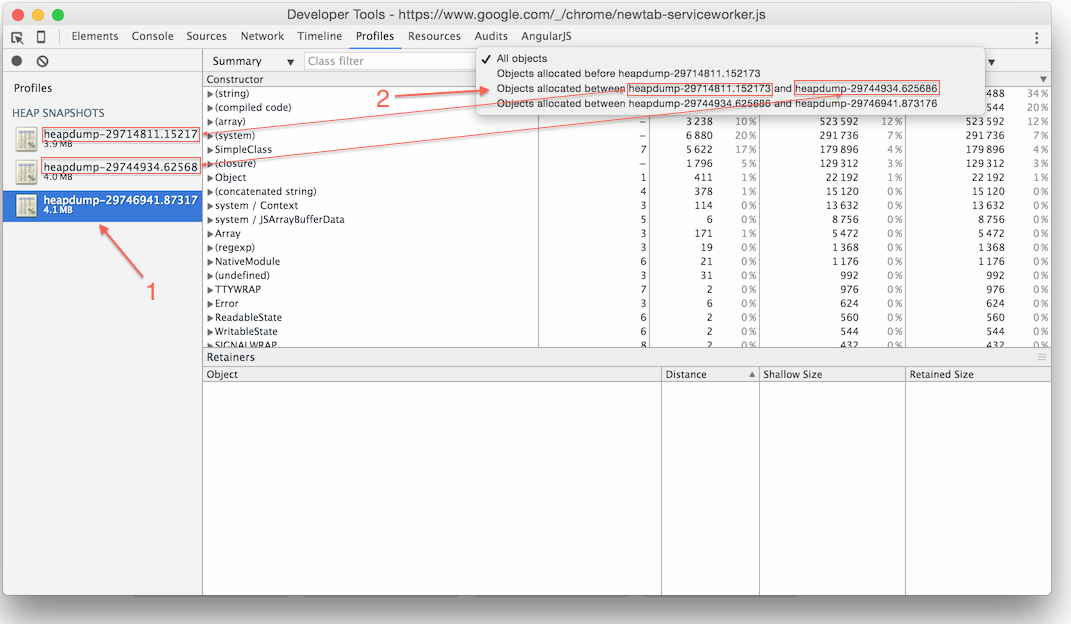
It will show you all of the objects that were allocated sometimes between your first heap dump and your second to last heap dump. That fact that these objects are still hanging around in your last heap dump are cause for concern and should be investigated, since they should have been picked up by Garbage Collection.
Pretty amazing stuff actually, but not very intuitive to find and easy to overlook.
Ignore anything in brackets, such as (string), at least at first
After completing the outlined steps for the sample app, I ended up with the following view.
Note that the shallow size represents the size of the object itself, while retained size represents the size of the object and all of its children.
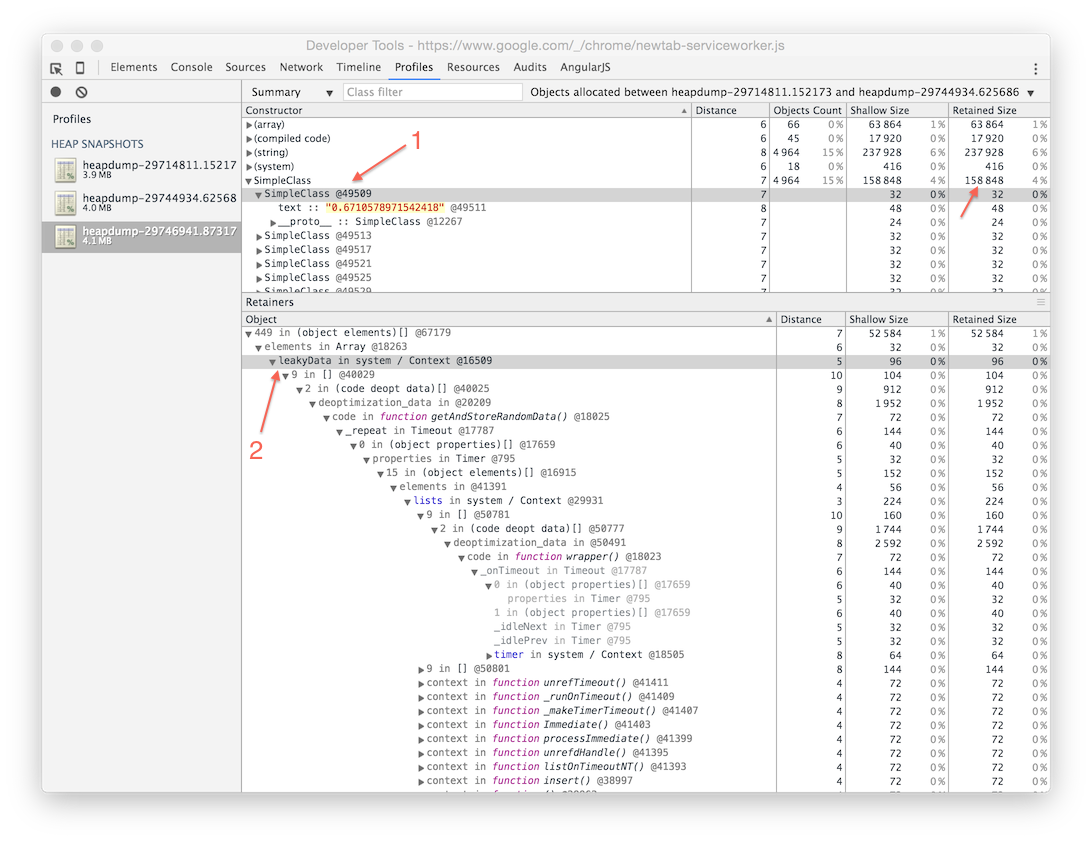
There appear to be 5 entries that were retained in my last snapshot that should have not been there: (array), (compiled code), (string), (system), and SimpleClass.
Out of all of them only SimpleClass looks familiar, since it came from the following code in the sample app.
var randomObject = new SimpleClass(randomData);
Code language: JavaScript (javascript)
It may be tempting to start looking through the (array) or (string) entries first. All objects in Summary view are grouped by their constructor names. In case of array or string, those are constructors internal to the JavaScript engine. While your program is definitely holding on to some data that was created through those constructors, you would also get a lot of noise there, making it harder to find the source of the memory leak.
That is why it’s much better to skip those at first, and instead to see if you can spot any more obvious suspects, such as the SimpleClass constructors in the sample app.
Clicking on the drop down arrow in the SimpleClass constructor, and selecting any of the created objects from the resulting list, will populate the retainer path in the lower part of the window(see the image above). From there it’s very easy to track that the leakyData array was holding on to our data.
If you are not as fortunate in your app, as I was in my sample app, you might have to look at the internal constructors (such as strings) and try to figure out what is causing the memory leak from there. In that case, the trick would be to try to identify groups of values that show up often in some of the internal constructors groups, and try to use that as a hint pointing to a suspected memory leak.
For example, in the sample app case, you may observe a lot of strings that look like random numbers converted to strings. If you examine their retainer paths, Chrome Dev Tools will point you towards the leakyData array.
Step 4. Confirm that the issue is resolved
After you have identified and fixed a suspected memory leak, you should see a big difference in your heap usage.
If we uncomment the following line, in the sample app:
cleanUpData(leakyData, randomObject); //<-- Forgot to clean up
Code language: JavaScript (javascript)
And re-run the app as described in the Step 1, well observe the following output:
Program is using 3756664 bytes of Heap.
Program is using 3862504 bytes of Heap.
Program is using 3763208 bytes of Heap.
Program is using 3763400 bytes of Heap.
Program is using 3763424 bytes of Heap.
Program is using 3763448 bytes of Heap.
Program is using 3763472 bytes of Heap.
Program is using 3763496 bytes of Heap.
Program is using 3763784 bytes of Heap.
Program is using 3763808 bytes of Heap.
Program is using 3763832 bytes of Heap.
Program is using 3758368 bytes of Heap.
Program is using 3758368 bytes of Heap.
Program is using 3758368 bytes of Heap.
Program is using 3758368 bytes of Heap.
And if we plot the data it would look as follows:
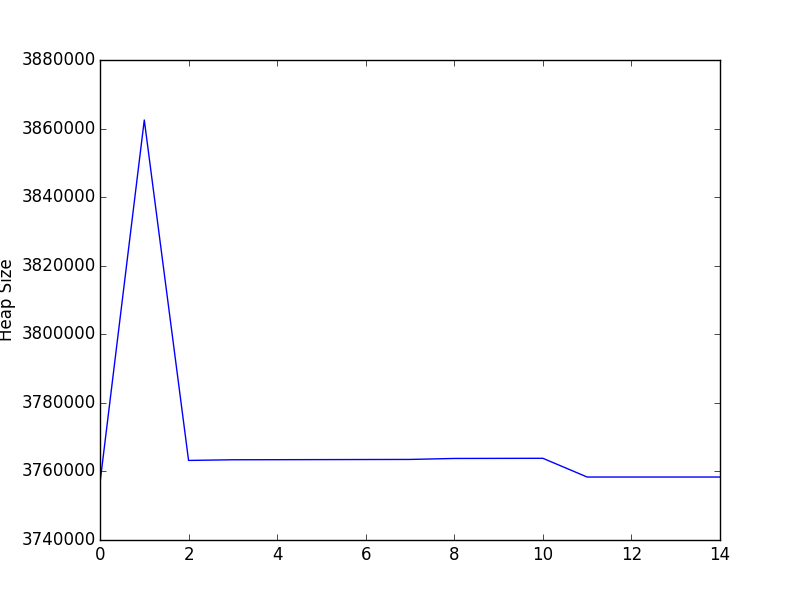
Hooray, the memory leak is gone.
Note that the initial spike in the memory usage is still there, this is normal while you wait for program to stabilize. Watch out for that spike in your analysis to make sure you are not interpreting it as a memory leak.
Links to some other resources
Memory Profiling with Chrome DevTools
Most of the stuff you’ve read in this article has been taken from the video above. The only reason this article exists, is because I had to watch this video 3 times over the course of two weeks to spot (what I believe to be) the key points, and I wanted to make the discovery process easier for others.
I would highly recommend watching this video to supplement this post.
Another helpful tool – memwatch-next
This is another cool tool that I think is worth mentioning. You can read more about some of the reasoning for it here (short read, worth your time).
Or just go straight to the repo: https://github.com/marcominetti/node-memwatch
To save you a click, you can install it with npm install memwatch-next
And then use it with two events:
var memwatch = require('memwatch-next');
memwatch.on('leak', function(info) { /*Log memory leak info, runs when memory leak is detected */ });
memwatch.on('stats', function(stats) { /*Log memory stats, runs when V8 does Garbage Collection*/ });

//It can also do this...
var hd = new memwatch.HeapDiff();
// Do something that might leak memory
var diff = hd.end();
console.log(diff);
Code language: JavaScript (javascript)
The last console log will output something like the following, showing you what types of objects has grown in memory.
{
  "before": { "nodes": 11625, "size_bytes": 1869904, "size": "1.78 mb" },
  "after":  { "nodes": 21435, "size_bytes": 2119136, "size": "2.02 mb" },
  "change": { "size_bytes": 249232, "size": "243.39 kb", "freed_nodes": 197,
    "allocated_nodes": 10007,
    "details": [
      { "what": "String",
        "size_bytes": -2120,  "size": "-2.07 kb",  "+": 3,    "-": 62
      },
      { "what": "Array",
        "size_bytes": 66687,  "size": "65.13 kb",  "+": 4,    "-": 78
      },
      { "what": "LeakingClass",
        "size_bytes": 239952, "size": "234.33 kb", "+": 9998, "-": 0
      }
    ]
  }
}
Code language: JSON / JSON with Comments (json)
Pretty cool.
JavaScript Memory Profiling from developer.chrome.com
Definitely a must read. It covers all of the subjects that I’ve touched up on and many more, in much greater detail with much greater accuracy 🙂
Don’t overlook the talk by Addy Osmani at the bottom, where he mentions a bunch of debugging tips and resource.
You can get the slide here: and the sample code here:
Summary
Please consider reviewing this guide on Amazon, if you found it helpful.
- Trigger Garbage Collection manually when trying to reproduce and identify a memory leak. You can run Node with
--expose-gcflag and callglobal.gc()from your program. - Take at least 3 Heap Dumps using https://github.com/bnoordhuis/node-heapdump
- Use 3 heap dump method to isolate the memory leak
- Confirm that memory leak is gone
- Profit